On November 9 2014, the Sydney Morning Herald (SMH) reported that new research has indicated that the gender wealth gap between single males and single females has widened significantly in the past decade[1]. They cited Curtin University researchers who have conducted an analysis of the University of Melbourne’s Household Income and Labour Dynamics in Australia (HILDA) study[2], to make this revelation. The head researcher Siobhan Austen is quoted to state that, “…despite young women now outnumbering young men in our universities quite substantially, we are not seeing a dramatic shift in the gender pay gap or the gender wealth gap.” The article proceeds to quote the figures; a substantial rise in wealth of younger single males as opposed to younger single females and a modest narrowing of the gap for older single persons. The researcher is quoted to state that these factors combined with a growing age expectancy for women will mean significant wealth disadvantage for older women in the immediate future. Finally, they point out a possible reason as to why this might be happening – the growth of housing asset values. They note that while women’s retirement fund contributions have been growing more rapidly than men’s, it was not nearly enough to offset the effect housing assets have on overall wealth.
A seasoned warrior, having spent some time in the trenches of this ideological conflict will know the target is the gender pay gap or in this case, the wealth gap, far across the no-man’s land of statistics and academia. Let us try to negotiate this treacherous landscape and see what we can learn from the HILDA study.
The assertions made in this article are dire, but its text contains the key: how many under-35’s own property? And has there not been a property bubble in Australia, which is constantly being lamented in the same publication as driving youth away from the property market and into rented accommodation and share housing[3]? Most importantly, what is the HILDA study?
The Household Income and Labour Dynamics in Australia study was initiated in 2001 by the Melbourne Institute of Applied Economics and Social Research at the behest of Australian Government’s Department of Social Services. Its two key features relevant to this article are that it is a household study, meaning all adults within a selected household are interviewed and is longitudinal – meaning that the same persons are interviewed in each iteration, which are referred to as “waves.” It targets poverty, income, reliance on social security benefits, joblessness and tries to estimate the respondents’ sense of well-being. Other data is sometimes collected and presented in “wave” publications, but each one contains at least 4 chapters: household and family life, income, employment and well-being.
These factors are explored using percentiles and quintiles and the dynamics of households moving between them as the survey waves are taken.
As such, it is not designed to be a gendered study – households are found to be of predominantly mixed gender, and no attempt at judgement of what the division of the assets between all people in the household is made. Gendered data is available, but only in areas whose study would be meaningful across the majority of the survey participants, for example spending habits. However, if one is so inclined, further analysis is possible by obtaining the survey’s data cubes from the university after some confidentiality paperwork and a fee. It would seem that HILDA is not the ideal tool for making a determination on the gender wealth gap and its choice for this purpose by these researchers emerges as questionable.
The data cubes that they use in their work quoted in the SMH article seem to have first became available in 2010 and date back to 2006 and 2002. Another iteration was released recently and though Austen’s latest publications on this subject are not available to the writer at the present time, an earlier article illuminates her methodology. Prepared for a 2010 economics conference, this paper explains that to make a gendered determination of people’s welfare, the HILDA household data had to be filtered down to sole-adult households,[4] and exclude single persons living in mixed households.
Approximately 7,500 households and 12,500 persons were interviewed across the relevant HILDA waves,[5] of which about 10% were determined to be single-person households or exactly 773 men and 1,153 women, according to Austen. As such, the SMH journalist purports to project the results obtained from about 1,800 loners onto a population of 20,6 Million (estimated in 2006).
And that is not to say that a wealth gap was nowhere to be found in the data. On the contrary, it was located to begin at the 67th percentile. In other words, the top third of young loners who were men, on average reported to be more well-off than young loner women. It is illustrated in the following graphic. Note that a substantial stretch before the 67th percentile is dominated by Single Female Households (SFH).
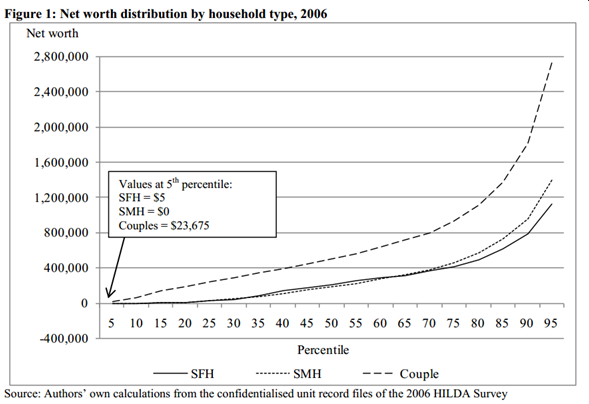
The mention of the value of property as being the driving force behind this disparity suddenly resonates in its proper context: if you are well-off enough to own property before the age of 35, chances are that your net worth would have grown together with the current Australian property bubble, granted that Austen’s most recent results (based on wave 10 of HILDA, published in 2013) are not available for scrutiny at the time of writing.
The HILDA study can be quoted to elucidate the matter:
“Distribution of wealth
In Australia, as in other Western countries, wealth is much more unequally distributed than income. The findings that wealth and income are not very highly correlated, and that wealth inequality is greater than income inequality, are both primarily due to the greater dependence of wealth on age, or rather on saving as one ages. Wealth also depends somewhat on inheritance, although contrary to widespread impressions, most wealthy people are ‘self-made’ rather than being beneficiaries of large inheritances (Business Review Weekly, 2004). So wealth accumulates primarily via both voluntary saving and compulsory superannuation, and these savings grow with compound interest as people age. Of course households with higher incomes are able to save more.[6]”
In other words, find a partner, work hard and save. So, let us explore some HILDA statistics.
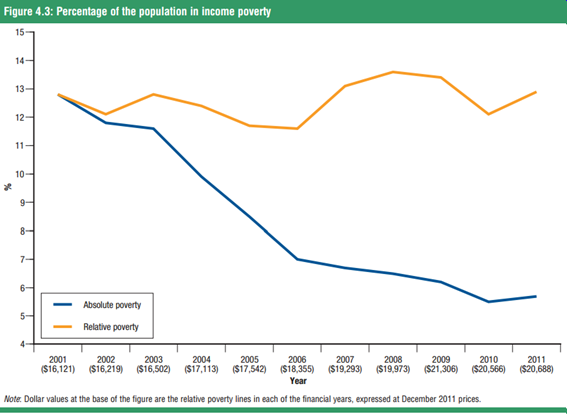
The most striking finding is probably the decline in absolute poverty in Australia. Over the course of the last decade there has been approximately a 6% change downwards. The pulse of the global economy, meanwhile can be detected in the levels of relative poverty[7]:
The study also provides an indication as to how various demographics fare with this trend as the background. These are taken from Tables 4.5 and 4.6 of the 2014 HILDA publication.
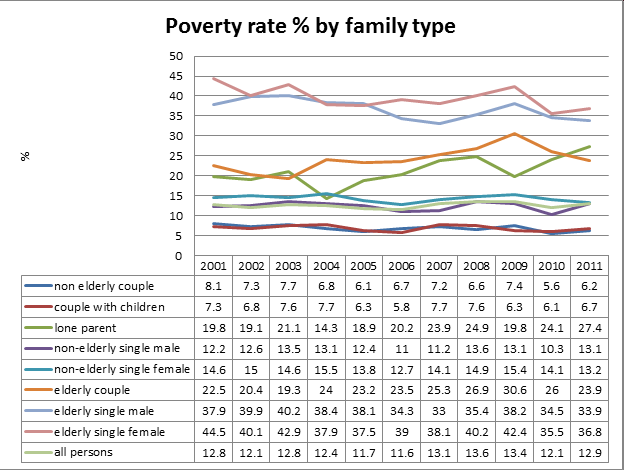
That non-elderly couples “win” and elderly singles “loose” comes as no surprise, though this statistic does not take into accout rent payments, meaning elderly people, who are more likely to own their accomodation may be over-represented as being poor in this chart. The HILDA survey explains futhert that some substantial fluctuations are due to natinal policy events, such as the 2006 Liberal Party “Welfare-to-work” initiative, that moved some onto a less generous welfare package, that seem to have contributed to a rise in poverty levels among sole parents. The same demographic seem to be the most affected by the Labor’s 2009 financial stimulus package, this time positively. However, lone parents seem to have done least well out of all the demographics displaying a 7.6% rise in poverty 2001-2011 and a general upward trend. This is also confirmed by a rise of child poverty of children living with sole parents[8] and the rate of reliance on welfare, dominated by sole parents[9]. Oddly, the report does not mention the introduction of Liberal’s Baby Bonus in 2002, with an increase in 2004. Designed to boost the birth rate to off-set the effects of an ageing population, the Baby Bonus cames with an income test – poorer families were in this way encouraged to have more children. Finally, elderly single female households display the most dramatic reduction in rates of povery of 7.7% with a similar recent (2009 onwards) trend for the elderly in general. This improvement seems to correlate with the 2009 rise in pensions.
As such, the financial welfare of a household when measured in terms of the likelihood of it being in poverty, seems to be affected most by age, having a partner and having children. These statistics do not show that poverty is a gendered issue. And while it can be argued that the problem areas – single parents and the elderly are dominated by women, it can also be argued also that male mortality rates and the rate of separation and divorce and the policies of the Australian Liberals are the companion culprit issues. However, the HILDA figures do not address those points and we have to move on.
Saving and taking investment risks with one’s savings has been identified as the primary contributing factors to wealth. Only the 2003 saving figures are available[10]:
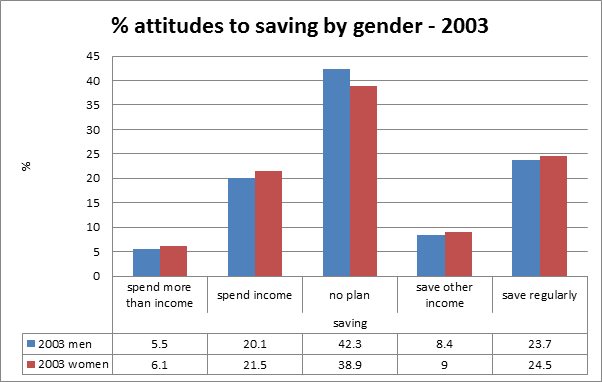
The 2003[11] and 2011[12] attitude to investment figure are available:
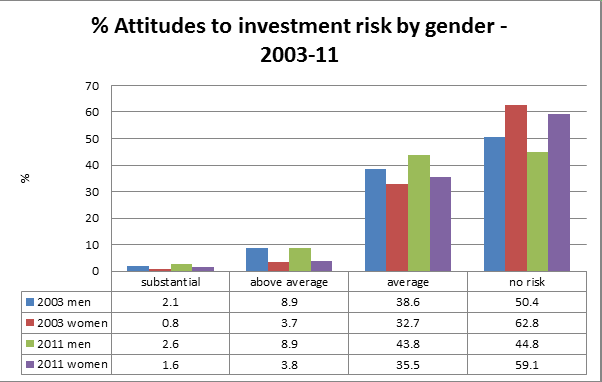
As can be seen from these figures, the notion that women are better savers is flawed – they are also more frivolous spenders. For simplicity’s sake, only the totals are displayed here, However, HILDA reports on these figures by age group. The dynamics are interesting and the reader is invited to investigate those on their own.
Employment is the white elephant in this article, so let us now talk about this animal. According to the HILDA statistics, men are consistently over represented in full-time employment. On the other hand, women are consistently over-represented in part-time work as well as the “not marginally attached” or the unemployable category. The figures look as follows[13]:
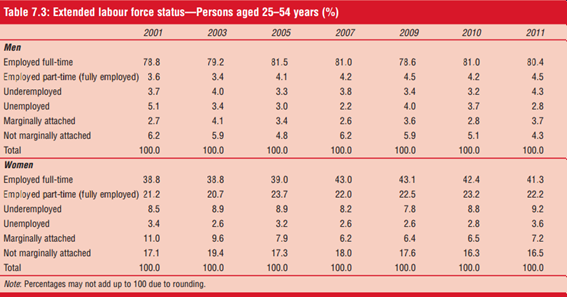
HILDA explanatory notes offer further perspective, which the reader may wish to take in. The table above obscures the dynamics of people moving in and out of unemployment and lower paid work. Of note is the greater tendency for men to transition from unemployment to full time work as opposed to women, who trended towards part-time work and a greater tendency for women to become unemployable. These are discussed in Section 7 of the 2009 report. Another thing not evident from this table is the number of hours spent in paid work. Figure 15.1 offers an idea as to what the situation might be:
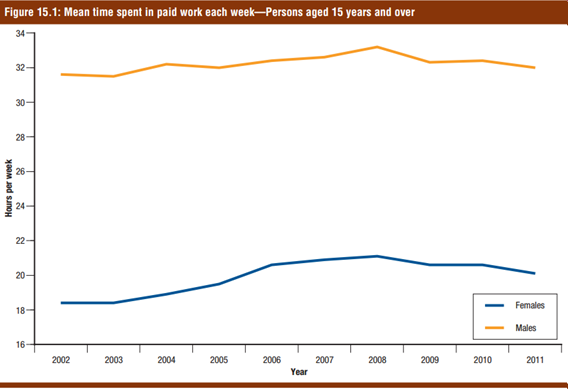
Again, no real surprises, although HILDA notes that the difference between the sexes has narrowed slightly in the past decade.
Finally, what makes a household wealthy? The answer is presented in Table 14.1, p 83 of the 2013 HILDA release[14], where it is stated that, “The composition of household wealth has changed markedly over the 2002 to 2010 period. Housing has grown considerably as a share of total assets, and superannuation has also steadily increased its share of assets.”
As such, SMH seems to severely misrepresent the Curtin University findings by claiming that they indicate a substantial shift in the gender wealth gap. For their part, the researchers do not attempt to make such a claim in their paper, however, their choice of sample design is questionable. The statistics themselves show a much more nuanced picture that does indicate a pay gap, but also provides ample economic data as to why it may exist. As is usual, the casual reader will not be expected to look into the figures themselves, contact researchers and ask questions and re-arrange the figures in Excel to get a better picture. They will be misled by dishonest reporting based on ideologically-driven research.
Overall, Australian society seem to remain committed to the traditional gender roles of men working and women caring for the home and children, with a gradual shift toward a greater participation of women in the workforce. Partnership, hard work, maturity and enterprise seem to be the keys to success. This sounds all the more ominous when poverty is declining for all except single parents. As such, the proclaimed demise of the nuclear family may not be a sound long-term economic policy. Poverty is the real problem, when we look at such figures, because unlike wealth, poverty is a limit. That wealth disparity between the sexes in the top third of society may have increased over the last decade, is frankly a first-world problem that needs to be set aside in policy and social discourse as long as poverty persists.
[1] http://www.smh.com.au/national/rich-man-poor-woman-the-gender-wealth-gap-widens-
20141108-11igay.html
[2] http://www.melbourneinstitute.com/hilda/
[3] http://www.smh.com.au/comment/sydney-housing-prices-lock-out-young-people-from-property-market-20140904-10c9nr.html
[4] https://www.melbourneinstitute.com/downloads/hilda/Bibliography/Conference_Papers/
Austen_etal_ACE10-128.pdf
[5] http://www.melbourneinstitute.com/downloads/hilda/Stat_Report/statreport-v5-2010.pdf
- Introduction p v
[6] http://www.melbourneinstitute.com/downloads/hilda/Stat_Report/statreport-v1-2006.pdf p55
[7] http://www.melbourneinstitute.com/downloads/hilda/Stat_Report/statreport-v9-2014.pdf p30
[8] Ibid – Table 4.6, p31
[9] Ibid – Figure 5.2, p 36
[10] Ibid – Table 1 p 57
[11] Ibid – Table 3 p 58
[12] http://www.melbourneinstitute.com/downloads/hilda/Stat_Report/statreport-v9-2014.pdf – Table 6.2, p41
[13] http://www.melbourneinstitute.com/downloads/hilda/Stat_Report/statreport-v9-2014.pdf p 51
[14] http://www.melbourneinstitute.com/downloads/hilda/Stat_Report/statreport-v8-2013.pdf